Traces
A trace represents one complete interaction between a user and your agent. It’s the primary unit that Latitude’s reliability features operate on: evaluations, annotations, issues, and simulations all reference traces.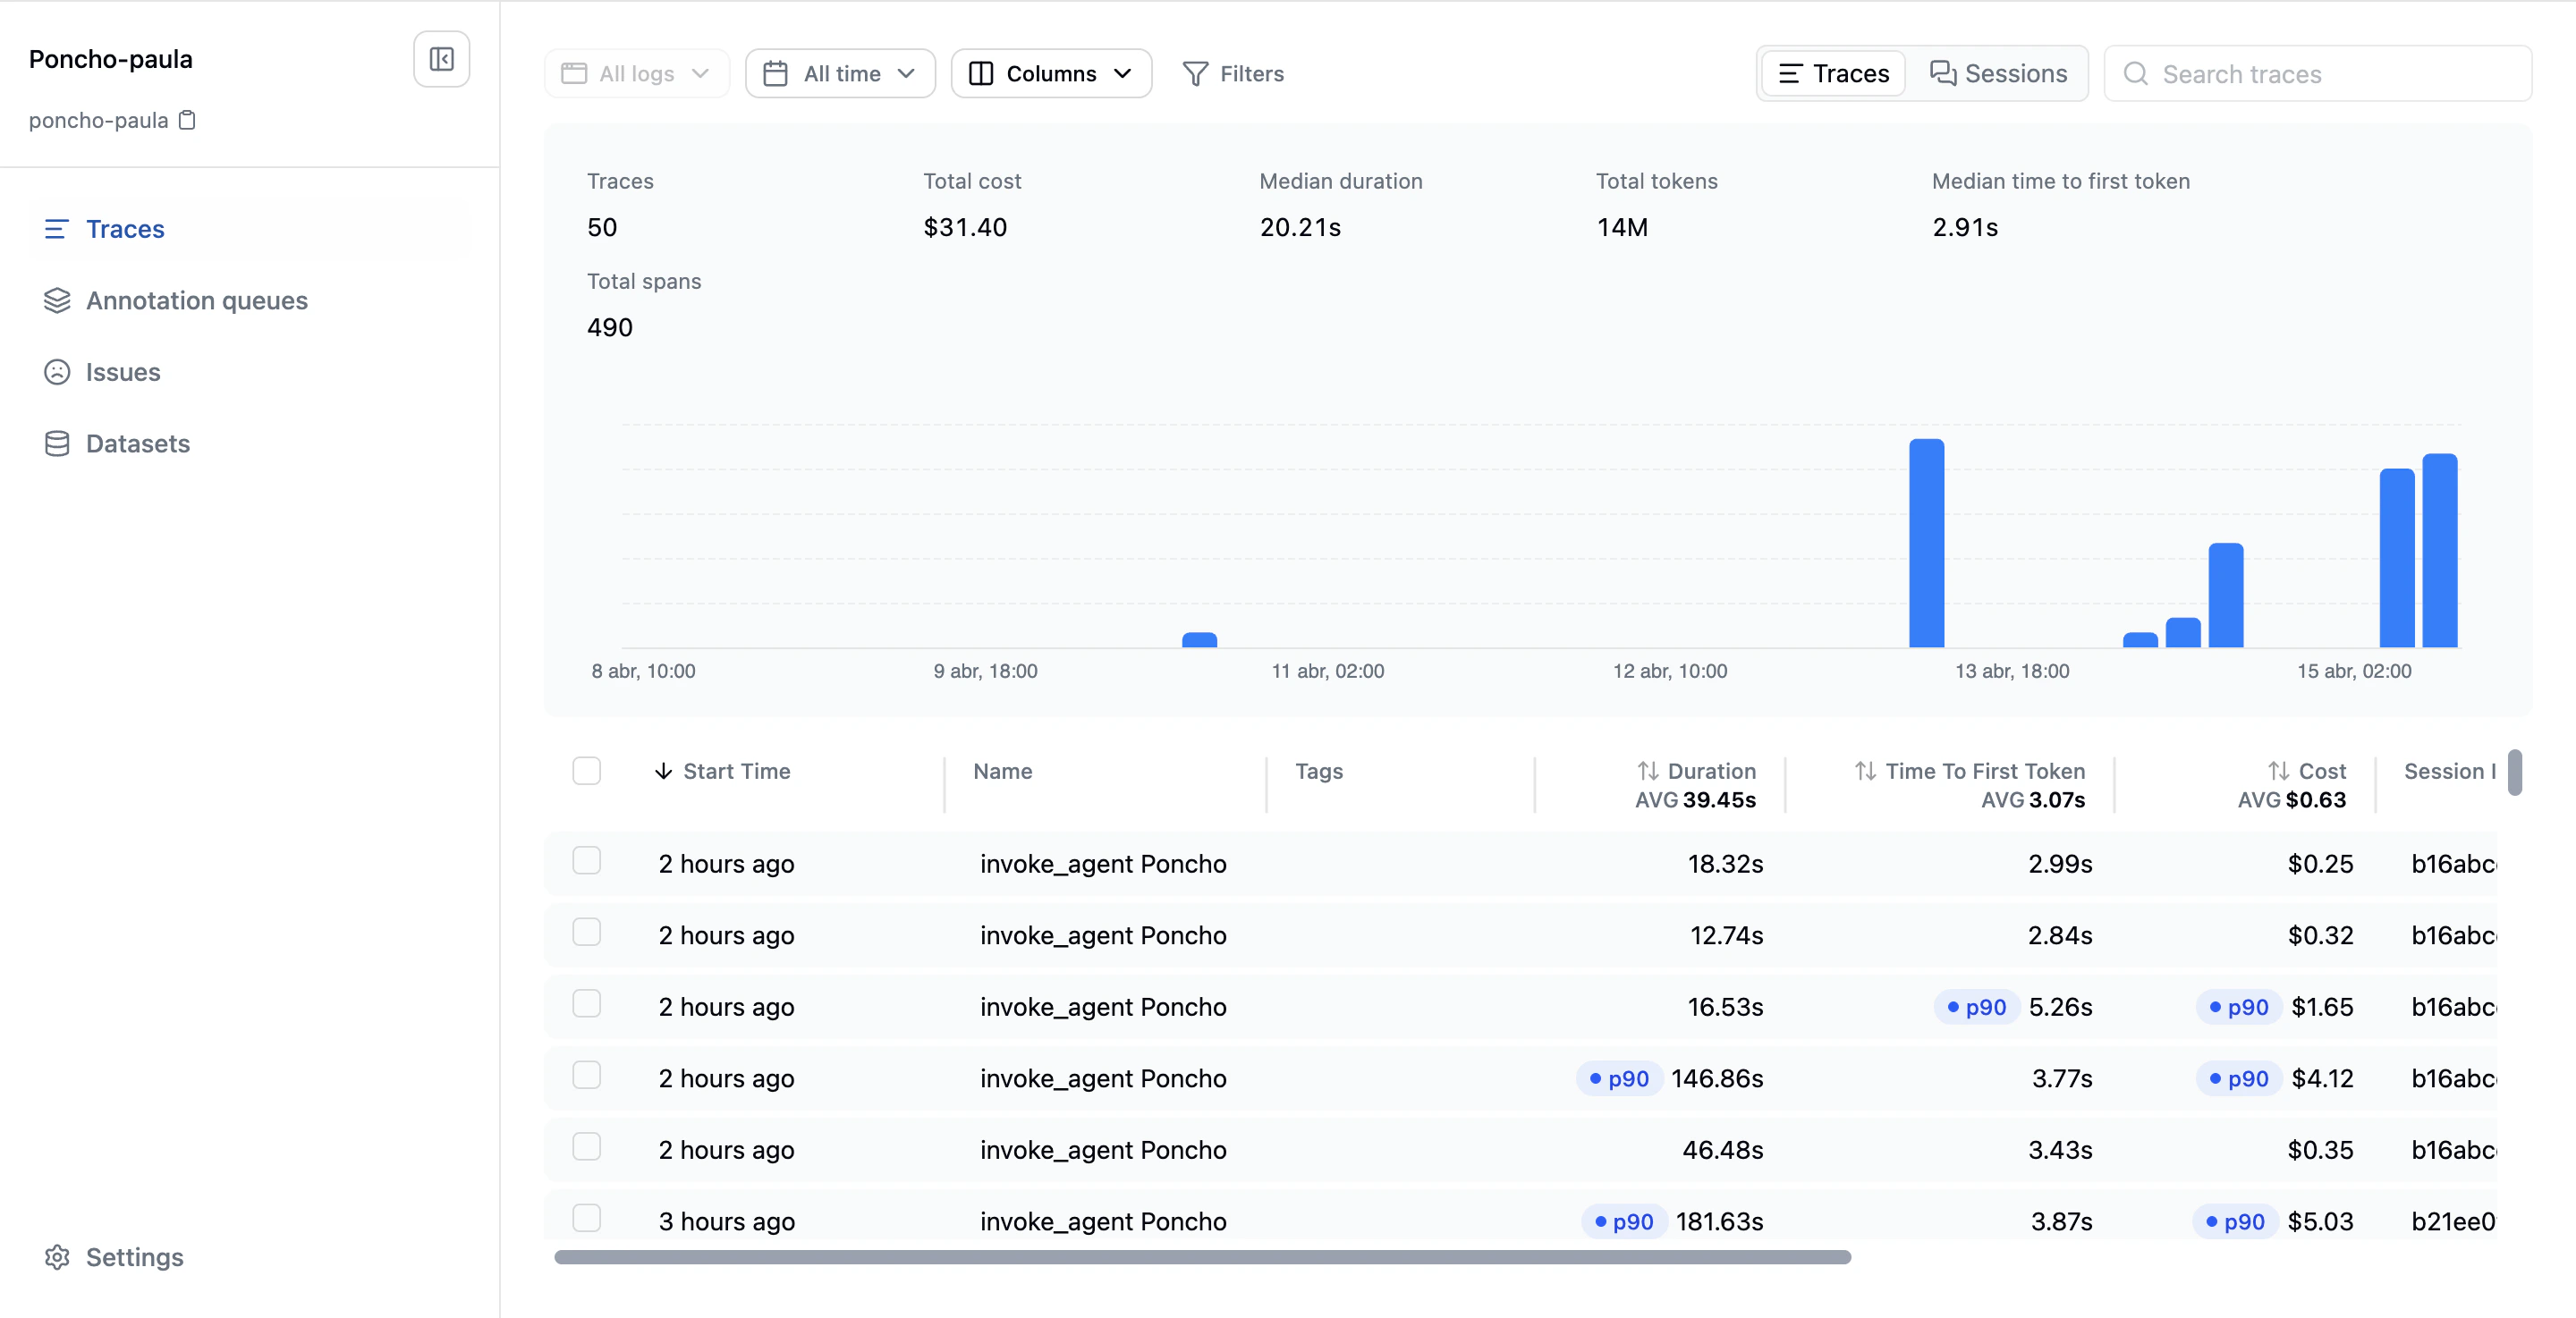
What’s in a Trace
A trace is composed of one or more spans: the individual operations your agent performed. A typical trace might include:- An incoming user message
- One or more LLM calls
- Tool invocations (search, database queries, API calls)
- Retrieval operations
- The final agent response
- Root span name: The top-level operation name
- Overall status: OK or error, derived from constituent spans
- Total duration: End-to-end timing
- Aggregated tokens: Total input and output tokens across all LLM calls
- Aggregated cost: Total cost across all provider calls
- Span count: How many individual operations were involved
- Error count: How many spans errored
- Models and providers: Which LLMs and providers were used
- Tags and metadata: Custom labels and structured metadata
Trace Completion
Latitude uses a debounce window to determine when a trace is finished. After the last span for a trace arrives, Latitude waits for a quiet period (default: 5 minutes). If no new spans arrive during that window, the trace is considered complete. Each new span arrival resets the debounce timer. This handles common scenarios:- Multi-step agent loops where tool calls and LLM responses alternate over time
- Parallel operations that complete at different times
- Retries and fallback logic
- Evaluation triggers check if any active evaluations should run against this trace
- Live annotation queues check if the trace matches any queue filters
- System annotation queues classify the trace against default review categories
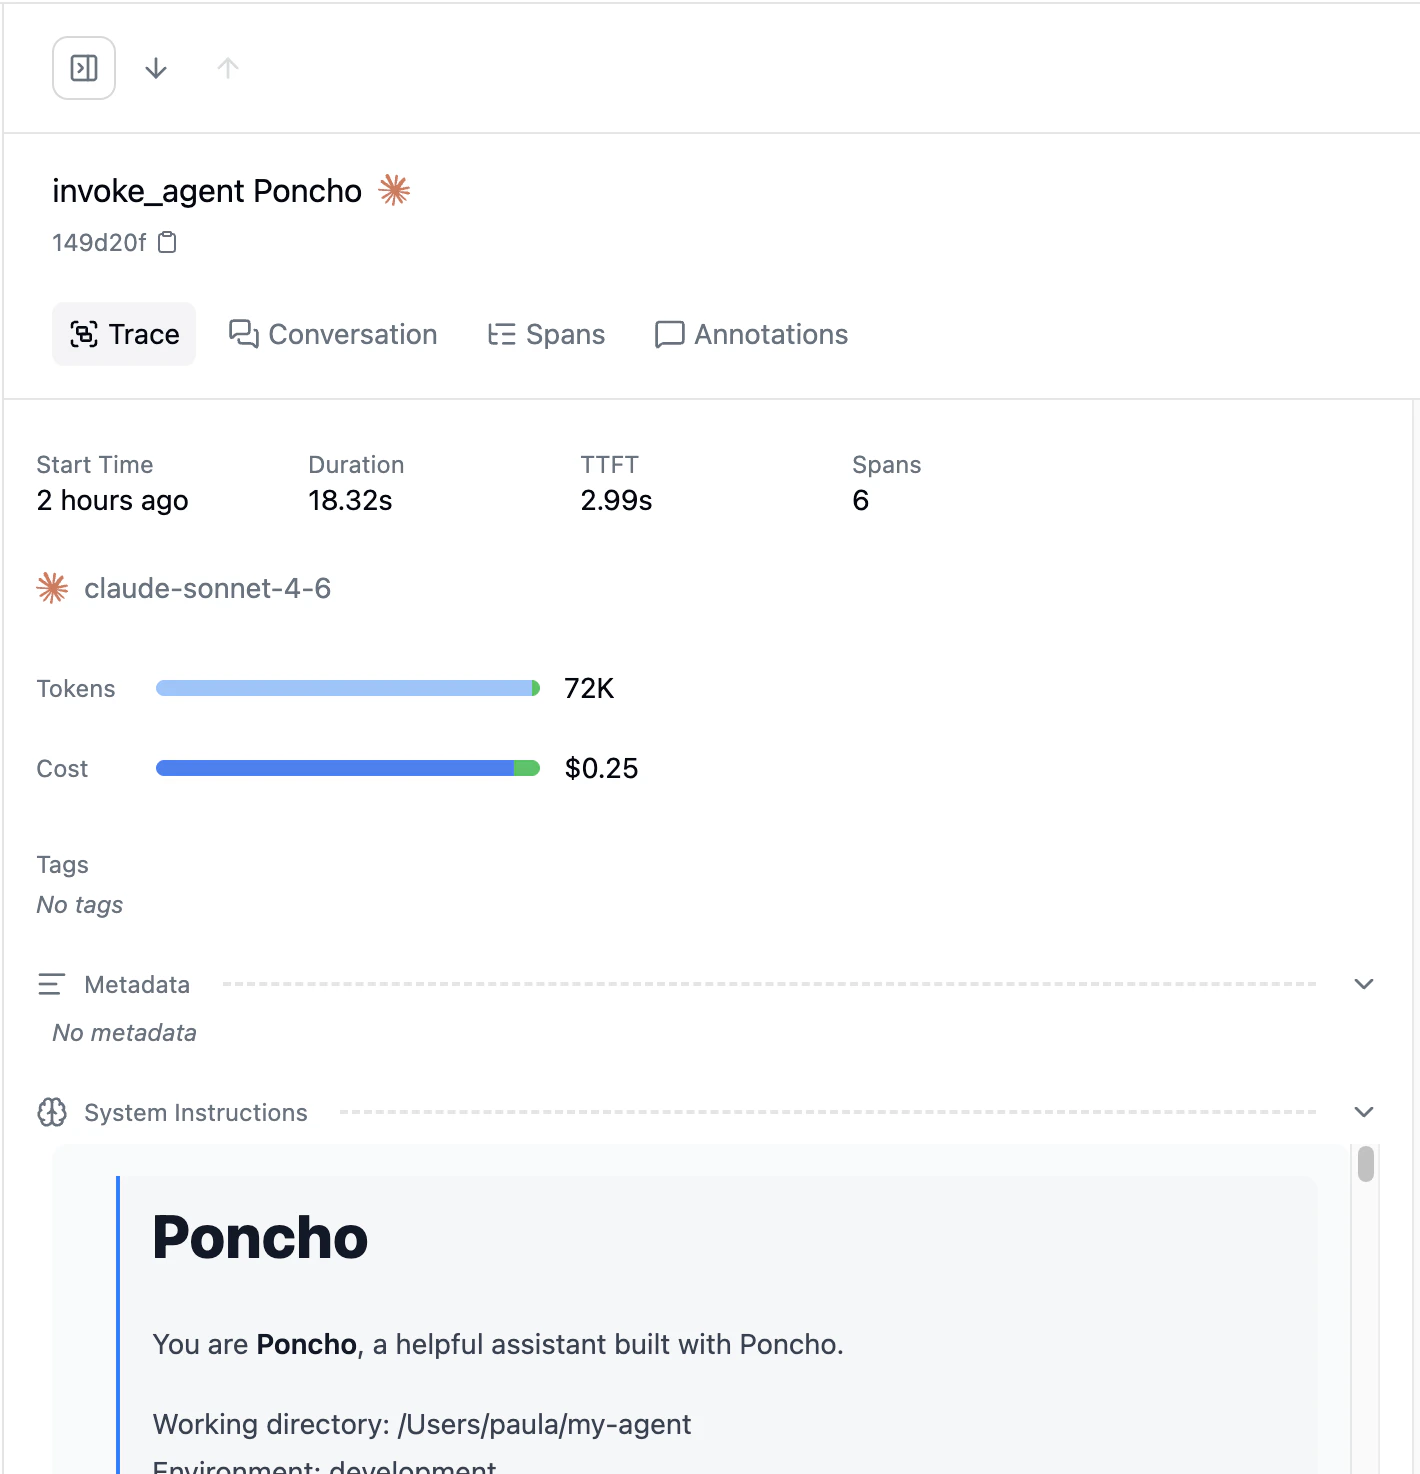
Viewing Traces
The Traces page in your project shows a table of all traces, newest first. Each row displays key metadata at a glance: name, status, duration, cost, tokens, and timestamp. Click on a trace to open the detail view, which shows:- The full conversation: All messages exchanged between user and agent
- The span tree: A hierarchical view of every operation your agent performed
- Scores: Any evaluation, annotation, or custom scores attached to this trace
- Metadata: Custom fields, timing details, and resource usage
Filtering Traces
Click the Filters button in the toolbar to open the filter panel. You can combine any number of filters to narrow your trace view.Available Filters
Status
Status
Filter traces by their completion status. Select one or more:
- OK: Trace completed without errors
- ERROR: At least one span in the trace errored
- UNSET: Status was not reported
Name
Name
Filter by the root span name (the
path you set in capture()). Type a name to match.Session ID
Session ID
Filter traces belonging to a specific session. Useful for viewing the full history of a multi-turn conversation.
Simulation ID
Simulation ID
Filter traces generated by a specific simulation run.
User ID
User ID
Filter traces by end-user identifier, if your application passes one via telemetry metadata.
Tags
Tags
Models
Models
Filter by the LLM model(s) used in the trace (e.g.
gpt-4o, claude-3.5-sonnet). Search and select from models seen in your project.Providers
Providers
Filter by the LLM provider(s) used (e.g. OpenAI, Anthropic, Azure). Search and select from providers seen in your project.
Services
Services
Filter by the service name reported by OpenTelemetry instrumentation.
Duration
Duration
Set a min/max range to filter traces by total duration (in nanoseconds).
TTFT (Time to First Token)
TTFT (Time to First Token)
Set a min/max range to filter by time to first token. This is useful for identifying slow-starting responses.
Cost
Cost
Set a min/max range to filter by total cost (in microcents). Useful for finding expensive traces.
Span Count
Span Count
Set a min/max range for the number of spans in a trace. Higher span counts typically indicate more complex agent operations.
Error Count
Error Count
Set a min/max range for the number of errored spans within a trace.
Tokens Input
Tokens Input
Set a min/max range for total input tokens across all LLM calls in the trace.
Tokens Output
Tokens Output
Set a min/max range for total output tokens across all LLM calls in the trace.
Metadata
Metadata
Filter by custom key-value metadata. Add one or more conditions in the form
key = value. This matches against the structured metadata your application sends with its telemetry.Combining Filters
All active filters are combined with AND logic. Traces must match every active filter to appear. For example:- Status = ERROR AND Cost > 100 microcents: find expensive failures
- Models = gpt-4o AND Duration > 5s: find slow GPT-4o traces
- Metadata
environment=productionAND Error Count > 0: find production errors
Traces and Sessions
When your application provides asession_id with its telemetry, Latitude groups related traces into sessions. You can filter traces by session ID to see the full conversation history, or navigate to the Sessions page for a session-focused view.
Next Steps
- Sessions: Session-level conversations and aggregation
- Scores: How scores attach to traces
- Annotations: Annotating directly from trace views