Issues
Issues are recurring failure patterns that Latitude discovers automatically from your agent’s interactions. Instead of manually sifting through traces to find problems, Latitude groups similar failures together and gives each pattern a name, a trend, and a lifecycle you can act on.The Issues Page
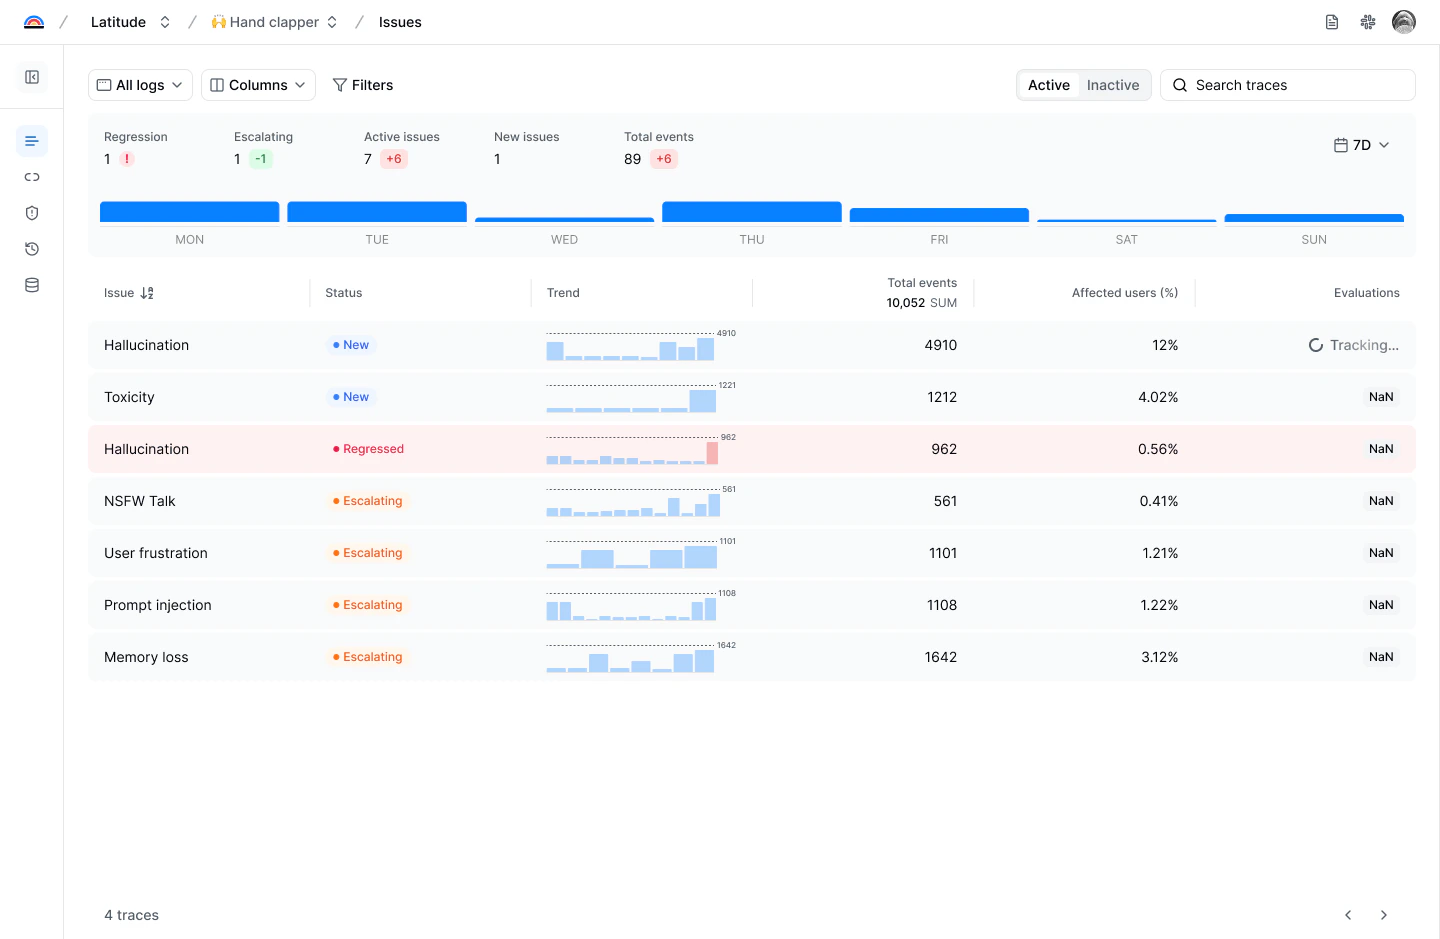
- Issue name: The automatically generated name for the failure pattern
- Status: The current lifecycle state (New, Escalating, Regressed, etc.)
- Trend: A sparkline showing recent occurrence activity
- Total events: How many times this issue has been detected
- Affected users: What percentage of users have been impacted
- Evaluations: Linked monitoring evaluations and their status
How Issues Are Discovered
When a score fails (from an evaluation, annotation, or custom source), Latitude checks whether the failure matches an existing issue or represents something new:- If it matches, the score is linked to that issue and its occurrence count increases
- If no match is found, a new issue is created automatically with a name and description generated from the failure
Issue Detail
Click any issue to open the detail drawer: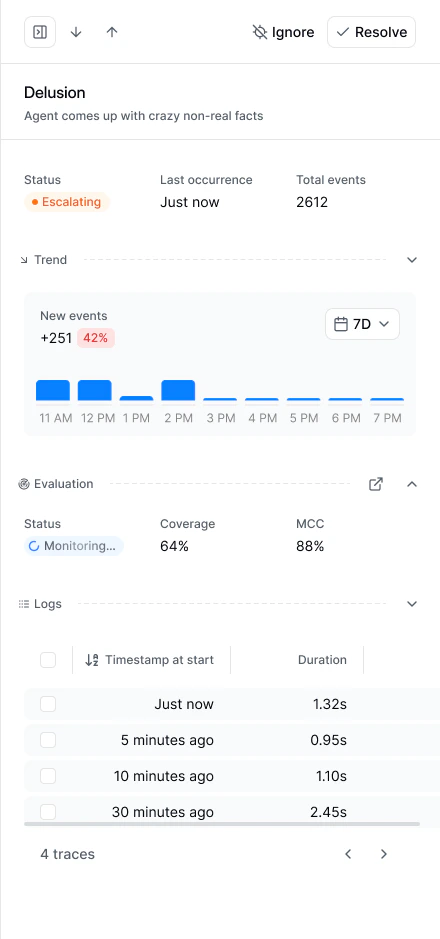
- Name and description: What the failure pattern is about
- Status, last occurrence, and total events: A quick summary of the issue’s current state
- Trend: A collapsible histogram showing new events over the selected time window, with a change indicator (e.g., “+251, 42%”)
- Evaluation: Linked monitoring evaluations with their status, coverage percentage, and alignment (MCC). Click the link icon to jump to the evaluation detail
- Logs: Recent traces where this issue was detected, with timestamps and durations. Click any trace to investigate the full conversation
Issue Lifecycle
Each issue has a lifecycle state that tells you where it stands:| State | Meaning |
|---|---|
| New | Discovered less than 7 days ago |
| Escalating | Occurrences are increasing significantly compared to the recent baseline |
| Resolved | No recent occurrences, or manually resolved by your team |
| Regressed | New occurrences appeared after the issue was previously resolved |
| Ignored | Manually ignored. Hidden from default views but can be restored |
What You Can Do with an Issue
Generate an Evaluation
Click Generate Evaluation on any issue to create an automated monitor. Latitude builds a script optimized to detect that specific failure pattern and runs it on live traffic going forward. Once active, you’ll see the evaluation’s status, coverage, and MCC in the issue drawer.Investigate with Traces
The Logs section in the detail drawer links directly to the traces where the issue was detected. Click into specific traces to see the actual conversations and understand what triggers the problem.Resolve or Ignore
- Resolve when the underlying problem is fixed. You can choose to keep linked evaluations active (to catch regressions) or archive them.
- Ignore when the issue isn’t worth tracking. This immediately archives linked evaluations and hides the issue from active views.
Issue Visibility
Latitude keeps the issues list actionable by filtering out noise:- Issues with human annotations are always visible
- Issues that were manually linked are always visible
- Low-evidence issues (only automated matches, no human confirmation) may be hidden until enough evidence accumulates
How Issues Connect to Other Features
| Feature | Relationship |
|---|---|
| Scores | Failed scores feed into issue discovery. Each issue groups scores with similar failure feedback |
| Evaluations | Issues can generate monitoring evaluations. Evaluation failures link back to their issue |
| Annotations | Human annotations confirm issue detections and improve evaluation alignment |
| Alignment | Annotations on issue-linked traces produce alignment metrics for the issue’s evaluations |
Next Steps
- Issue Management: Workflows for triaging, investigating, and resolving issues
- Evaluations: How evaluations connect to issues
- Annotations: How human feedback strengthens issue detection