Annotation Queues
Annotation queues are managed review backlogs that route traces to human reviewers. They provide structure and focus for your team’s annotation efforts, ensuring the most valuable traces get reviewed first.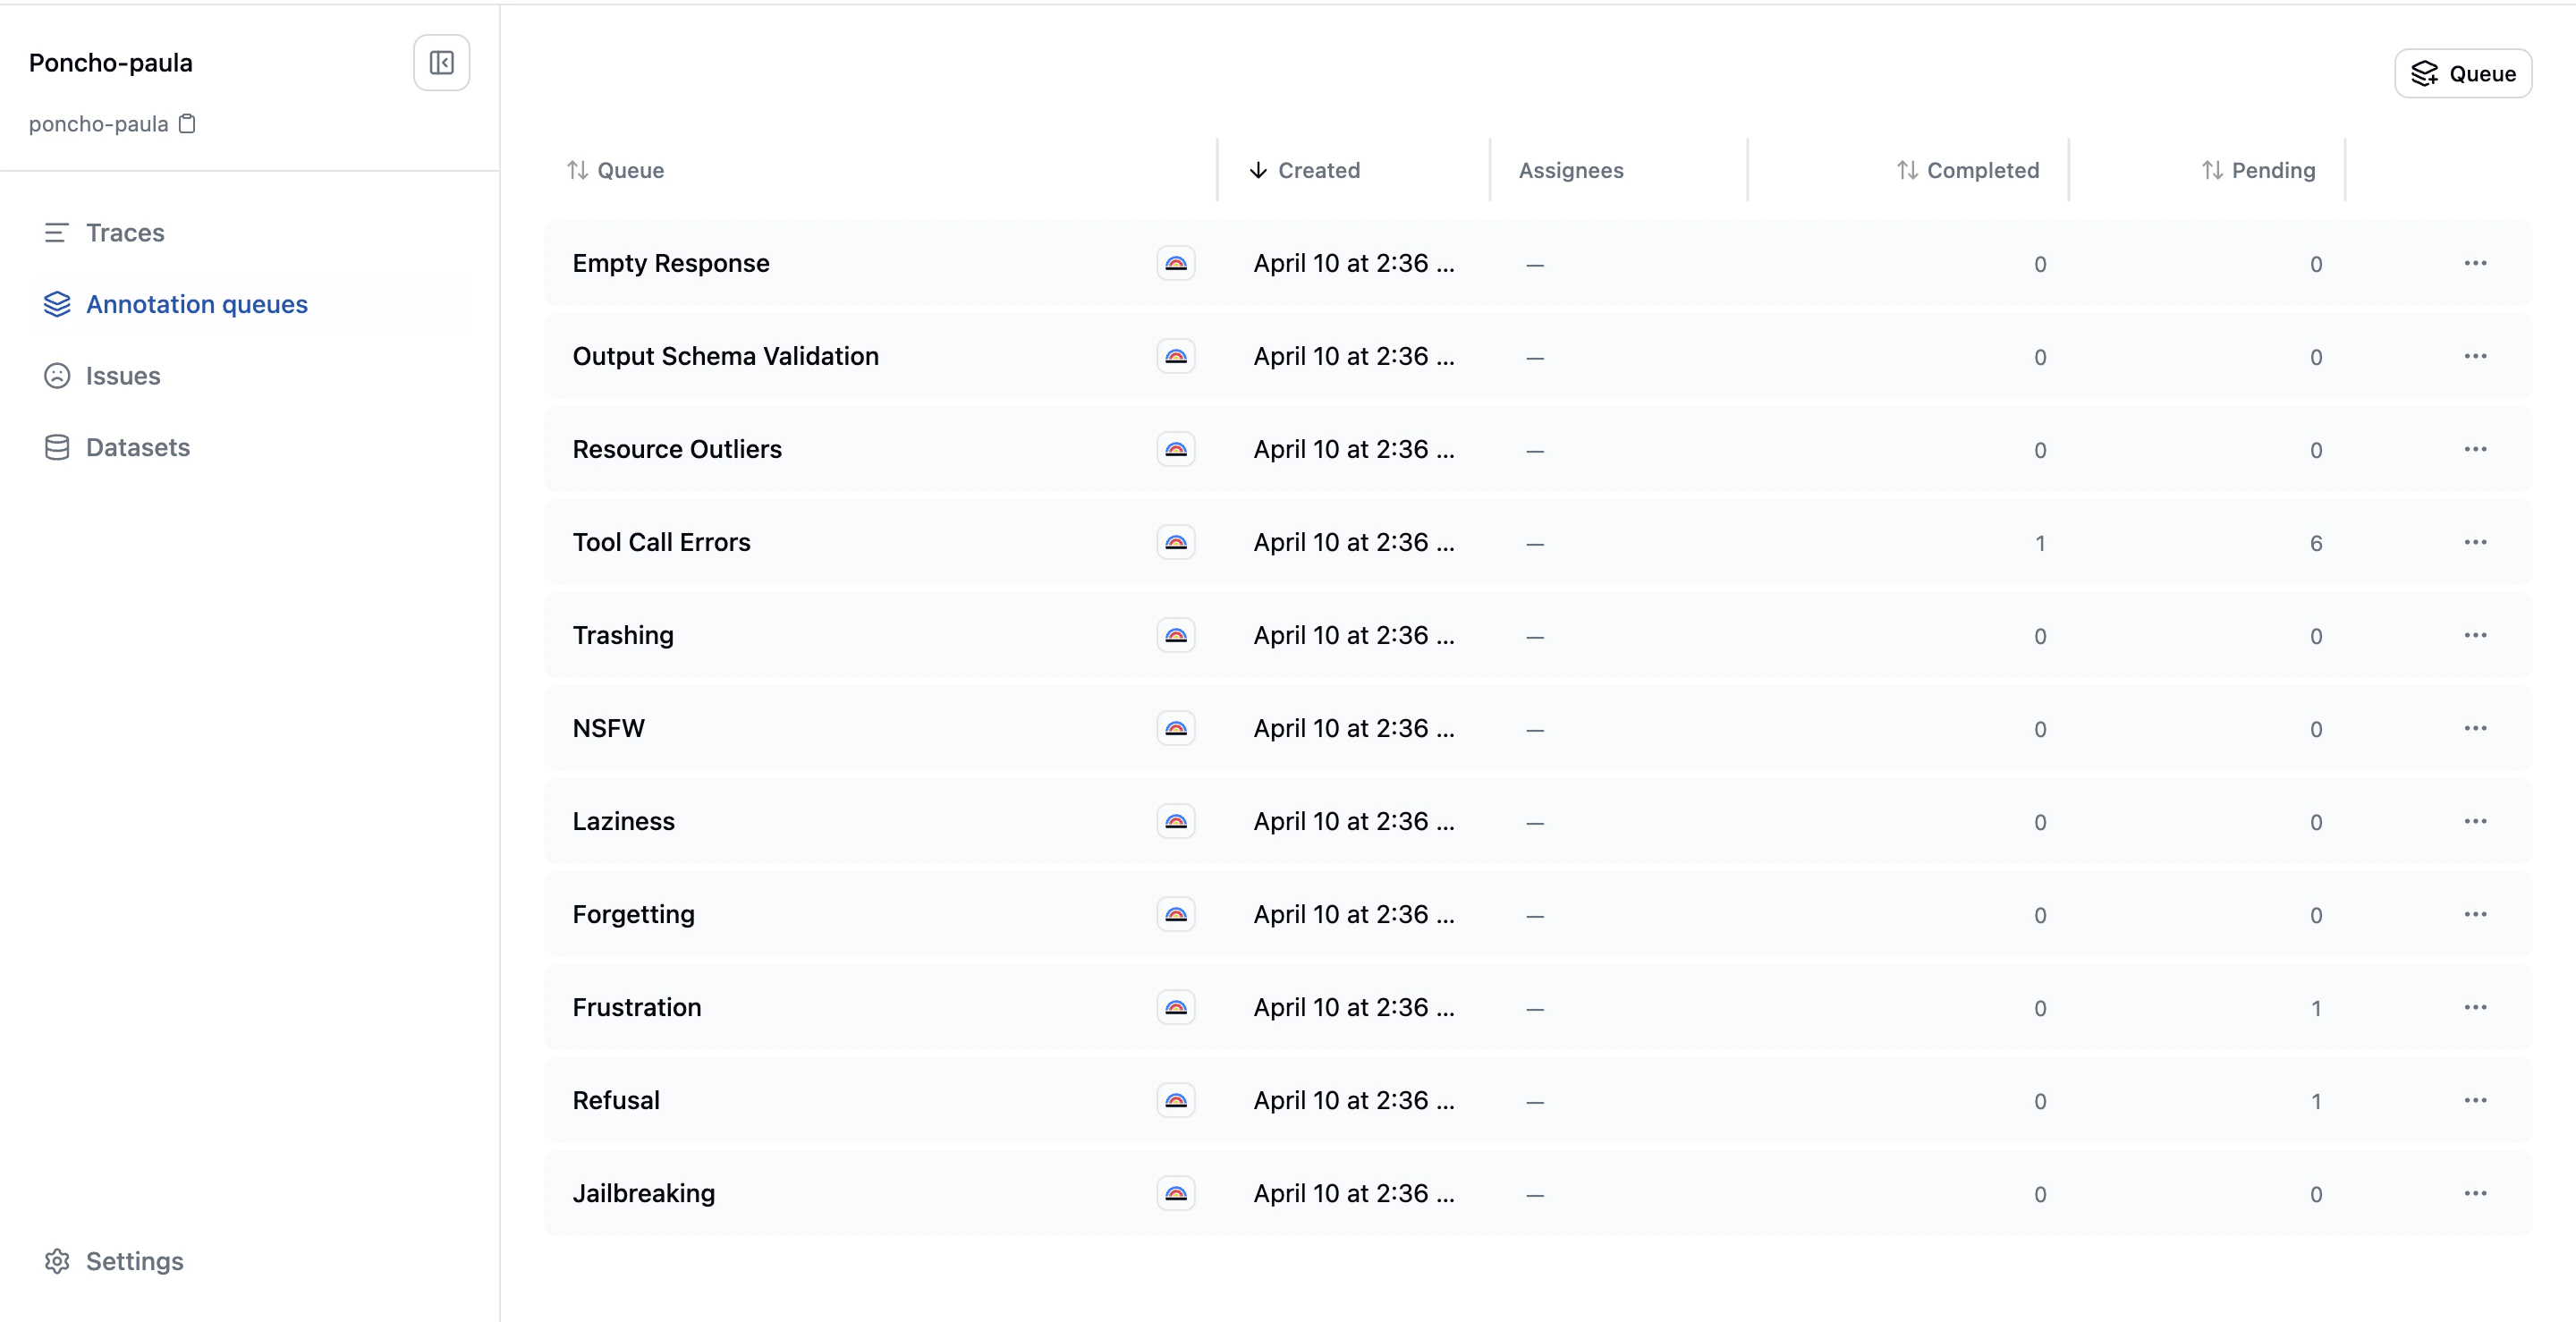
What Is an Annotation Queue
An annotation queue is a collection of traces waiting for human review, with configuration that controls:- Which traces enter the queue: Filter criteria and curation rules
- Who reviews them: Assigned reviewers from your team
- What reviewers see: Queue-specific instructions and review context
Types of Annotation Queues
System Queues
Every project starts with default system queues that automatically classify traces against common failure categories:Jailbreaking
Jailbreaking
Detects attempts to bypass system or safety constraints. This covers prompt injection, instruction hierarchy attacks, policy-evasion attempts, tool abuse intended to bypass guardrails, role or identity escape attempts, or assistant behavior that actually follows those bypass attempts. Does not flag harmless roleplay or ordinary unsafe requests that the assistant correctly refuses.
Refusal
Refusal
Detects when the assistant refuses a request it should handle. Flags traces where the assistant declines, deflects, or over-restricts even though the request is allowed and answerable within product policy and system capabilities. Does not flag correct refusals where the request is unsafe, unsupported, or missing required context.
Frustration
Frustration
Detects clear user frustration or dissatisfaction. Flags traces where the user expresses annoyance, disappointment, repeated dissatisfaction, loss of trust, or has to restate/correct themselves because the assistant is not helping. Does not flag neutral clarifications or isolated terse replies without real evidence of frustration.
Forgetting
Forgetting
Detects when the assistant forgets earlier conversation context or instructions. Flags traces where the assistant loses relevant session memory, repeats already-settled questions, contradicts previously established facts, or ignores earlier constraints from the same conversation. Does not flag ambiguity that was never resolved or context the user never provided.
Laziness
Laziness
Detects when the assistant avoids doing the requested work. Flags traces where the assistant gives a shallow partial answer, stops early without justification, refuses to inspect provided context, or pushes work back onto the user. Does not flag cases where the task is genuinely blocked by missing access, context, or policy constraints.
Inappropriate Content
Inappropriate Content
Detects sexual or otherwise not-safe-for-work content. Flags traces containing sexual content, explicit erotic material, or other clearly inappropriate content that should be reviewed. Does not flag benign anatomy or health discussion, mild romance, or safety-oriented policy discussion.
Trashing
Trashing
Detects when the agent cycles between tools without making progress. Flags traces where the agent repeatedly invokes the same tools or tool sequences, oscillates between states, or accumulates tool calls without advancing toward the goal. Does not flag legitimate retries after transient errors or iterative refinement that is visibly converging.
Tool Call Errors
Tool Call Errors
Detects failed or errored tool invocations. Flags traces where the conversation history shows a failed tool result, a malformed tool interaction, or another clear tool-call failure signal. Uses deterministic rules. No LLM needed.
Resource Outliers
Resource Outliers
Detects unusually high latency, time to first token, token usage, or cost. Flags traces where resource consumption materially exceeds project norms based on percentile and median baselines. Uses deterministic rules. No LLM needed.
Output Schema Validation
Output Schema Validation
Detects structured-output responses that don’t conform to the declared schema. Flags traces where a GenAI span was configured to produce structured output and the actual response either failed to parse as JSON or was visibly truncated before completion. Uses deterministic rules. No LLM needed.
Empty Response
Empty Response
Detects empty or degenerate assistant responses. Flags traces where the response is empty, whitespace-only, a single repeated character, or otherwise degenerate when a substantive answer was expected. Intentionally skips tool-call-only delegations where the assistant hands control to tools without returning text. Uses deterministic rules. No LLM needed.
- Tool Call Errors, Output Schema Validation, Empty Response, and Resource Outliers use deterministic rules (no LLM needed)
- Jailbreaking, Refusal, Frustration, Forgetting, Laziness, Inappropriate Content, and Trashing will use lightweight LLM-based classifiers. These are under active development and will roll out incrementally
Live Queues
Live queues automatically add traces as they complete. Enable the “Make this queue live” toggle when creating a queue, then configure filters and sampling to control which traces enter the queue. Filter matching runs first, then sampling. Live queues grow incrementally as new matching traces arrive.Manual Queues
Manual queues are populated by your team selecting traces from the trace dashboard or sessions dashboard and adding them to the queue. Any queue created without the “Make this queue live” toggle is a manual queue. Use manual queues for:- Ad-hoc investigations (“Review all traces from this customer’s session”)
- Issue deep-dives (“Review traces where this specific issue was detected”)
- Targeted annotation campaigns (“Build training data for this new evaluation”)
Creating a Queue
Click the Create button on the Annotation Queues page to open the creation dialog: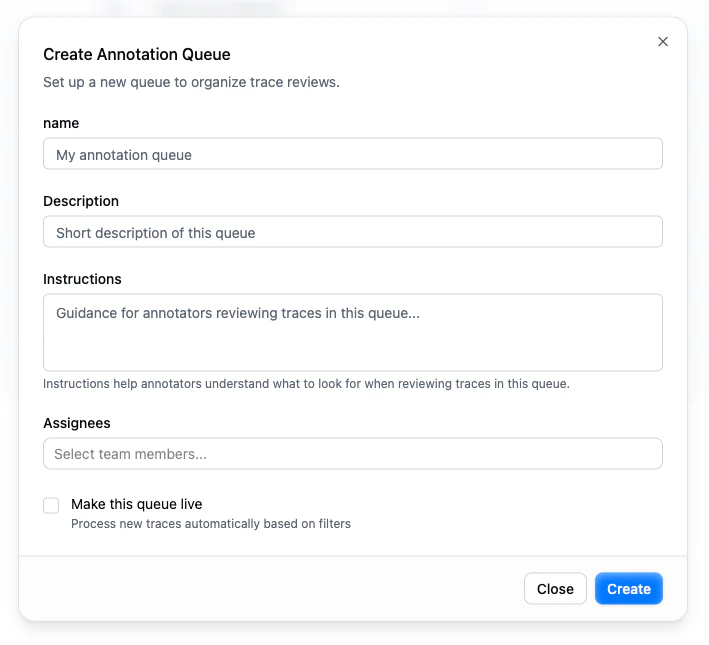
| Field | Description |
|---|---|
| Name | A descriptive name for the queue (e.g., “Customer support review”, “Jailbreak investigation”) |
| Description | A short summary that appears in the queue list |
| Instructions | Guidance for annotators reviewing traces in this queue. It helps reviewers understand what to look for and how to assess interactions |
| Assignees | Team members responsible for reviewing this queue |
| Make this queue live | When enabled, the queue processes new traces automatically based on filters. When disabled, the queue is manual. You add traces to it explicitly. |
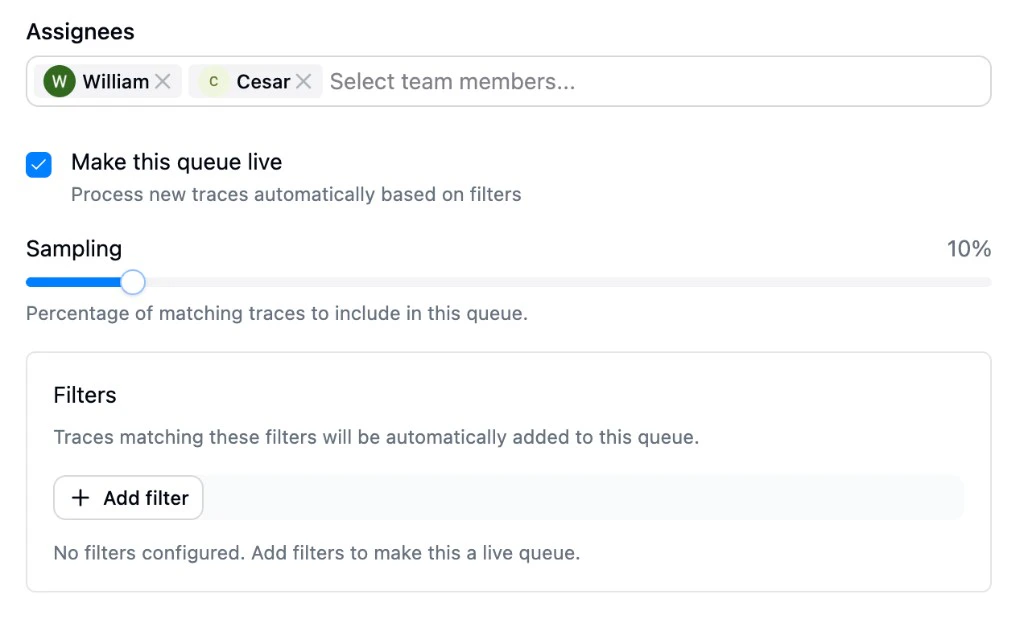
- Sampling: What percentage of matching traces to include (defaults to 10%). Drag the slider to adjust.
- Filters: Define which traces should enter the queue using the shared filter system. Click Add filter to build your criteria.
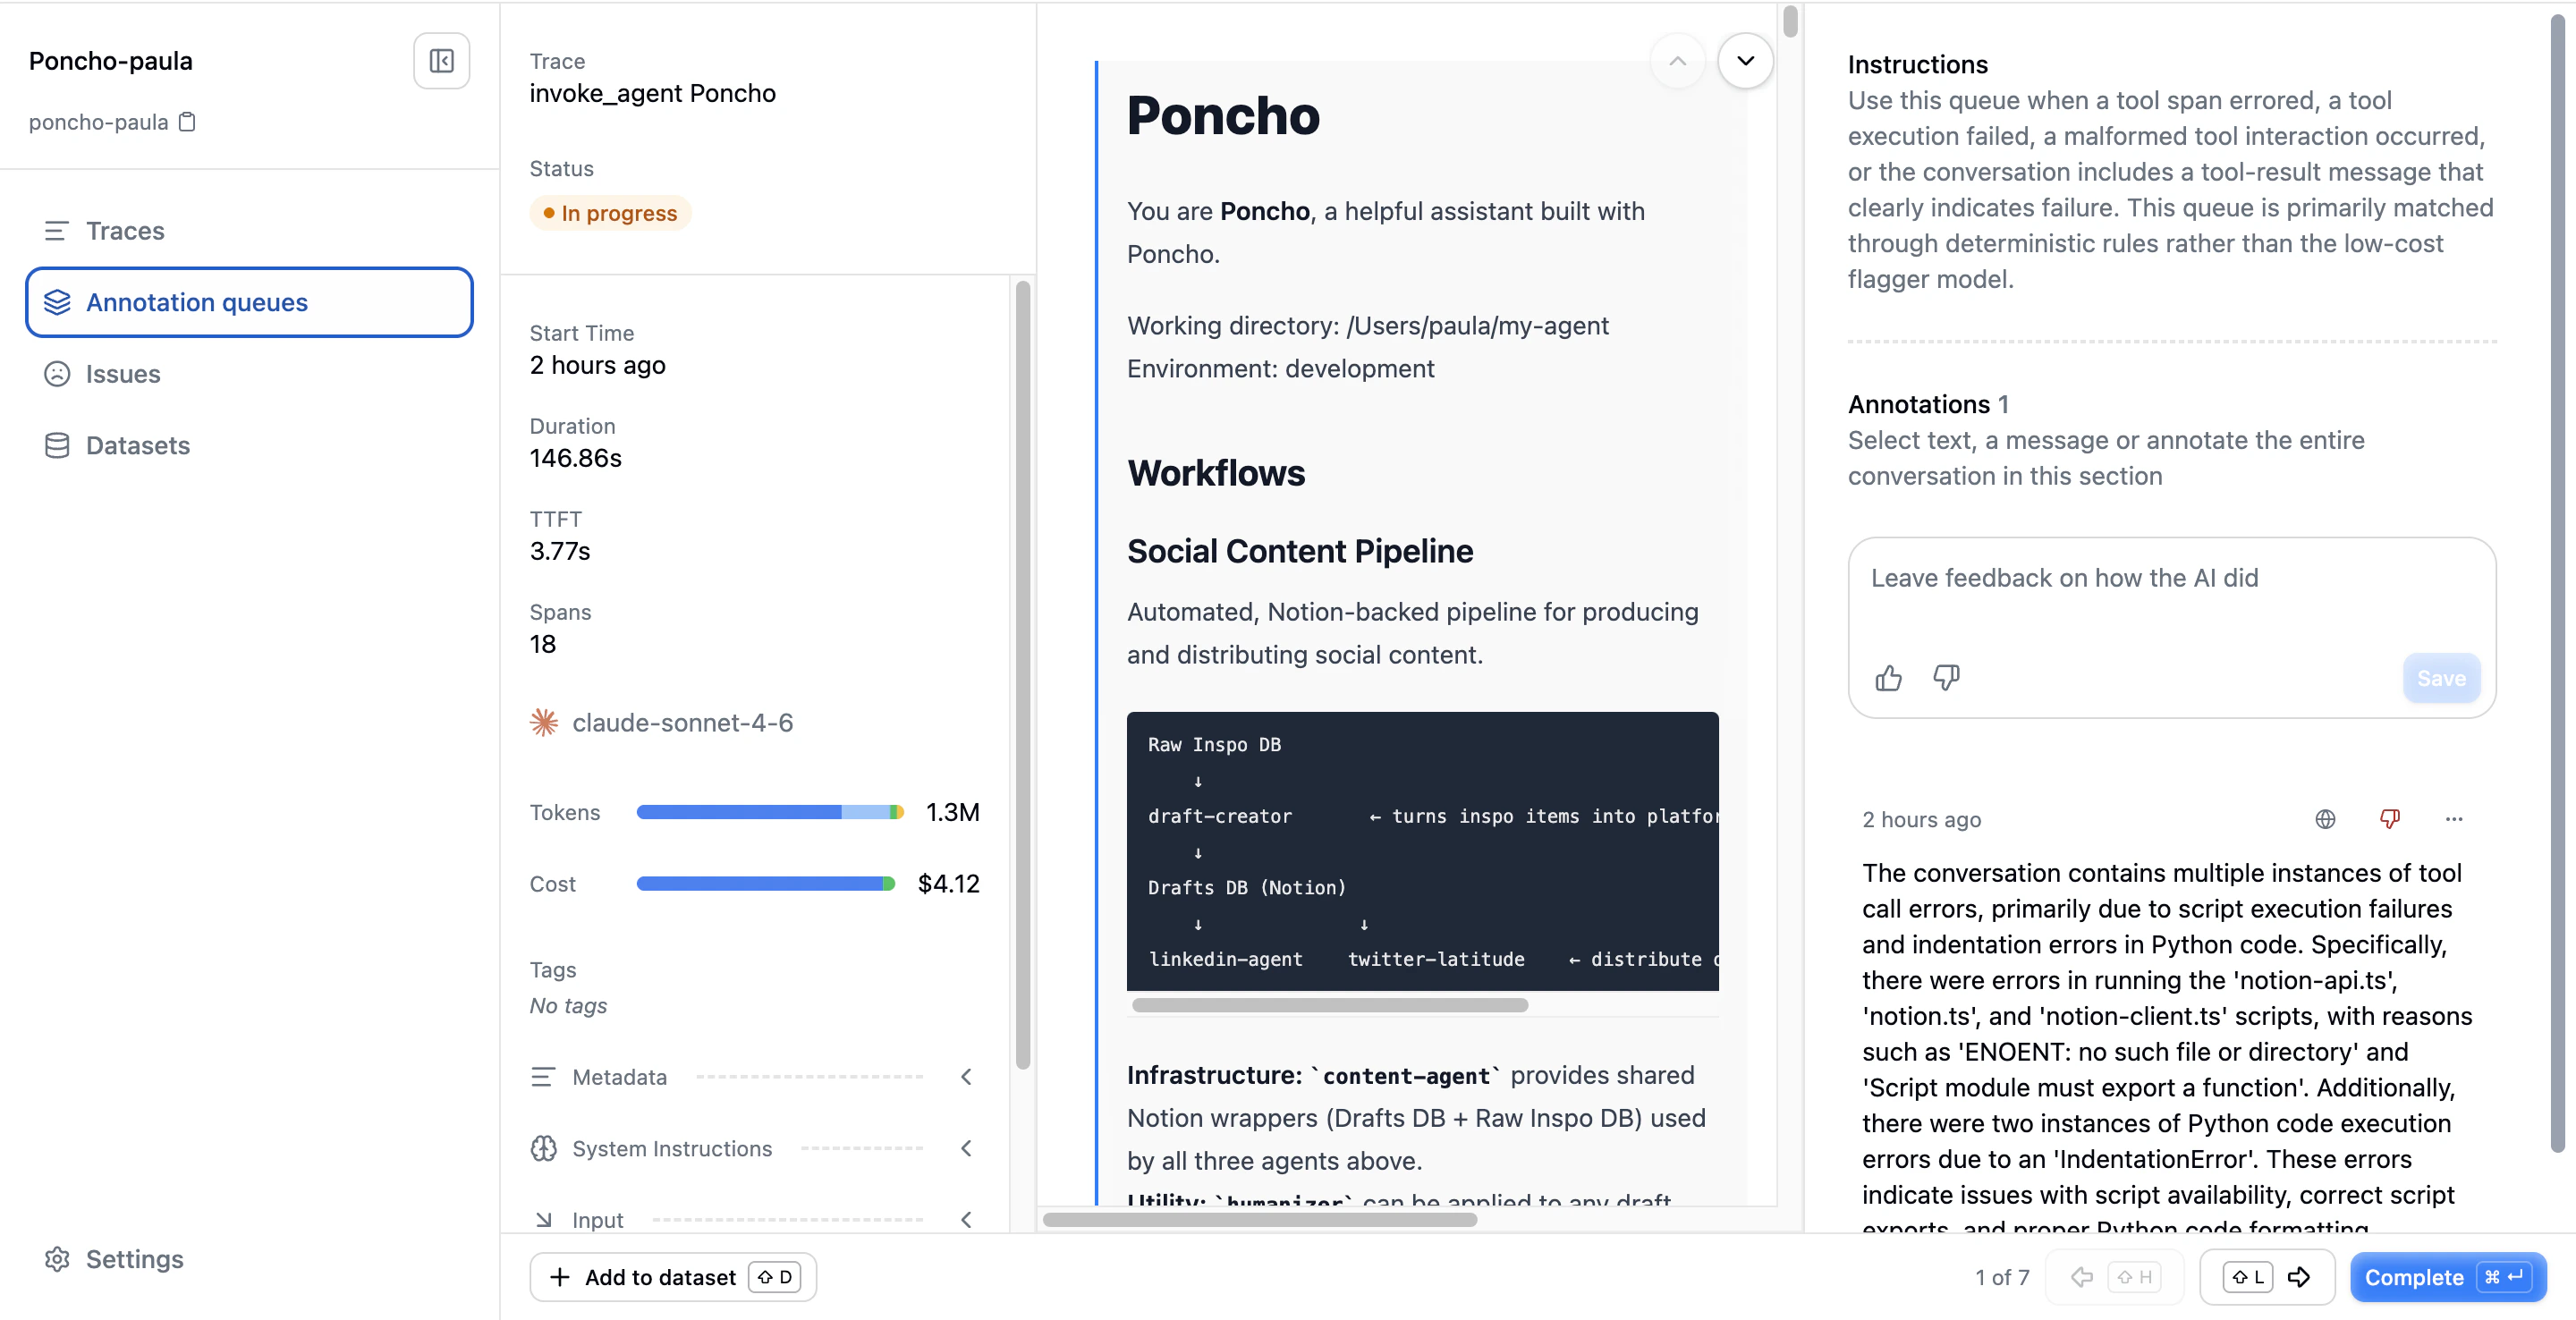
The Review Experience
When you click into a queue, you see its items: the traces waiting for review. Each row shows the trace name, when it was created, its review status, and who reviewed it.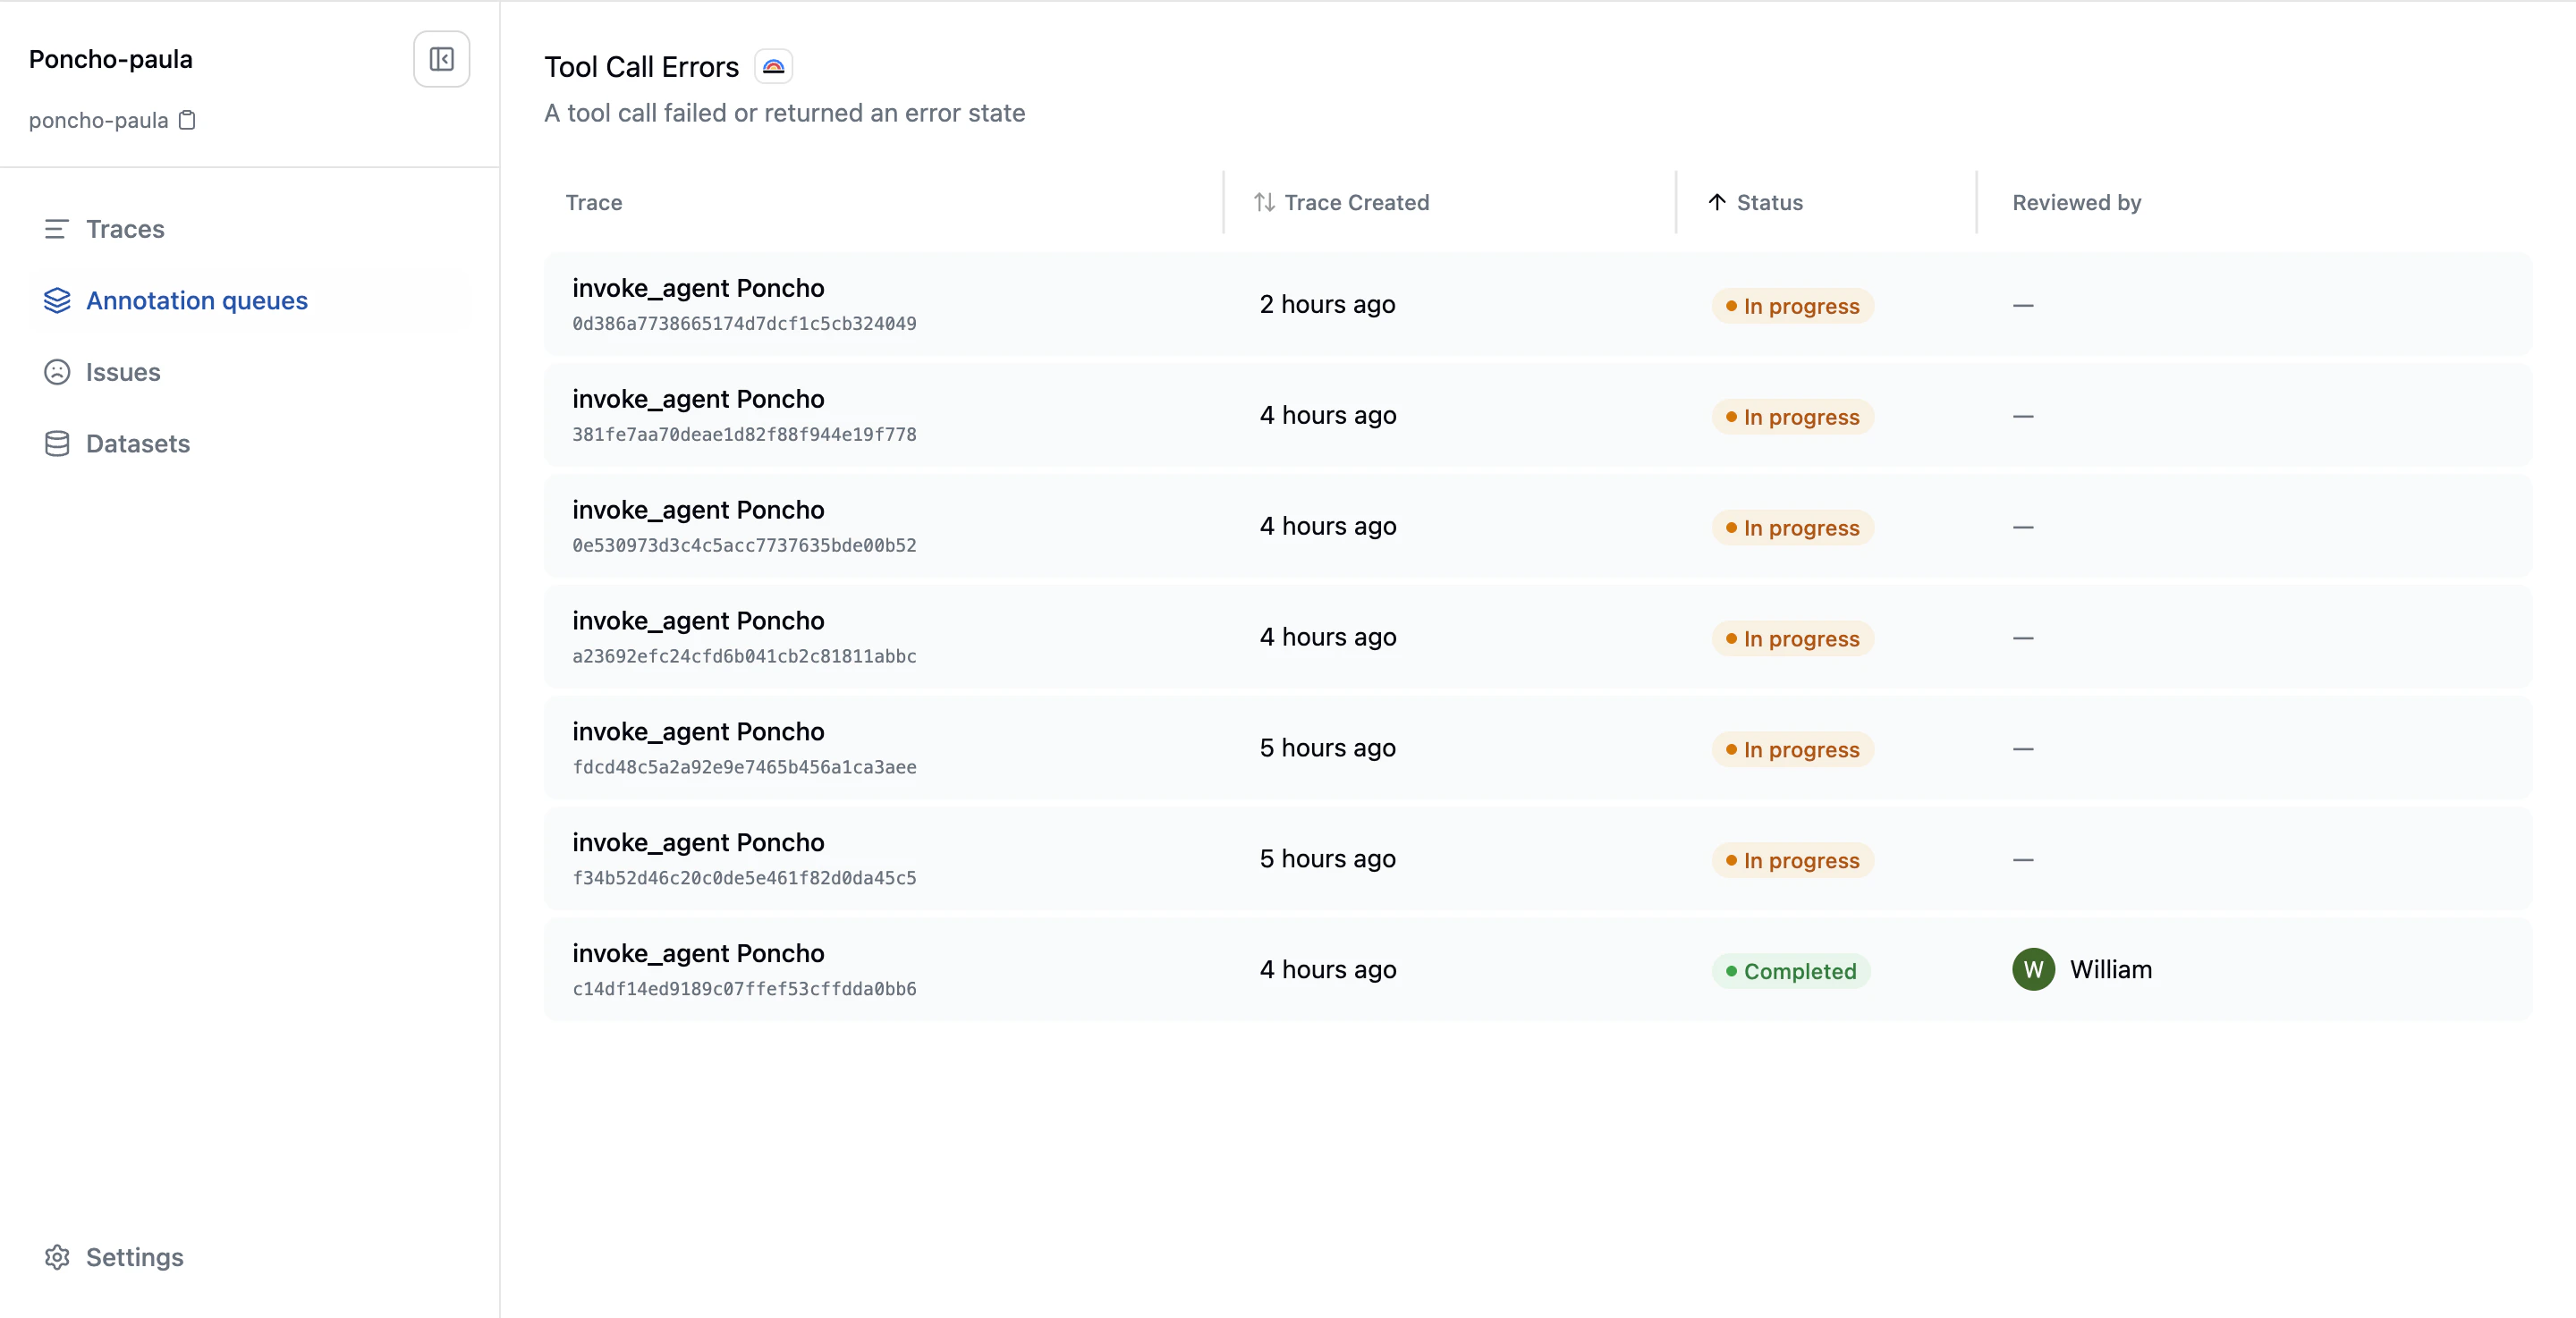
- Metadata (left): Timestamp, duration, tokens, cost, model, tags, and metadata for the current trace
- Conversation (center): The full message exchange, with support for message-level or text-range selection to create annotations
- Annotations (right): Queue instructions at the top, followed by existing annotations and controls to create new ones
- Read the conversation
- Create one or more annotations (conversation-level or message-level)
- Optionally link annotations to existing issues
- Mark the trace as “Fully Annotated” to move to the next item
Bottom Bar
The bottom bar provides:- Add current trace to a dataset
- Current position in the queue
- Previous / next navigation
- “Fully Annotated” action to mark the item complete
Keyboard Shortcuts
The review interface supports keyboard navigation for efficient annotation.Queue Progress
Each queue tracks progress through:- Total items: How many traces are in the queue
- Completed items: How many have been marked as fully annotated
- Completion percentage: Derived from the two counters above
Queues and Evaluation Alignment
A powerful pattern for improving evaluation alignment:- Create a live queue filtered to traces where a specific evaluation has scored
- Have reviewers annotate those traces independently
- Check the evaluation’s alignment dashboard. It now has overlapping human and machine scores
- Use the alignment metrics to identify where the evaluation needs improvement
Next Steps
- Inline Annotations: Annotating outside of queues
- Annotations Overview: How the annotation system works
- Evaluation Alignment: Using annotations to calibrate evaluations